Mastering the Momentum Indicator: A Beginner’s Guide to Smarter Trading
If you've ever tried your hand at the stock market or are just curious about how traders make decisions, you've probably heard of the term "momentum indicator". But what does it really mean? And more importantly, how can you use it to make smarter trades?
Imagine you're riding a bicycle down a slope. At first, you pedal hard, gaining speed. Then gravity kicks in—you’re moving fast without extra effort. That’s momentum. In trading, it works the same way. Once a stock starts gaining (or losing) speed, traders use momentum indicators to spot that movement early and jump in—or jump out—at just the right time.
In this article, we're diving into the world of momentum trading strategies, breaking it all down in simple terms, and showing you how to pick the best software for trading in India. Ready to ride the wave?
Learn about the best momentum indicator, momentum trading strategies, and the best software for trading in India in this beginner-friendly guide.
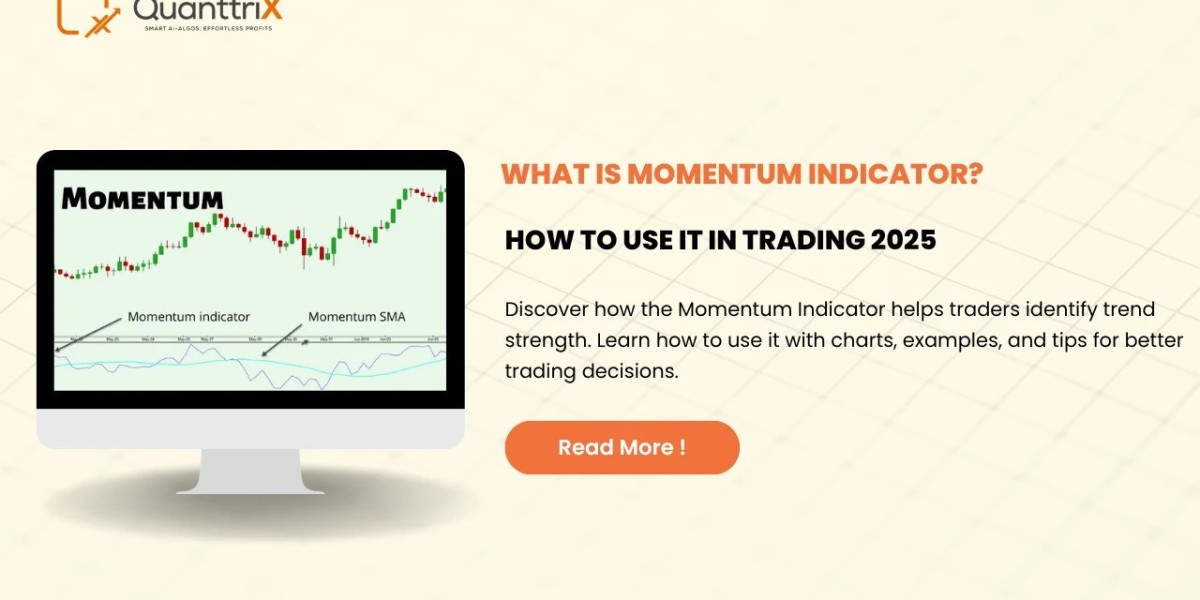
Introduction to Momentum Indicators
Let’s start at square one. A momentum indicator is a tool used by traders to measure the speed or strength of a stock's price movement. It’s like checking the wind before you fly a kite. The stronger the wind, the higher the kite goes. Similarly, the stronger the momentum, the more likely a stock will continue moving in its current direction—up or down.
Why Momentum Matters in Trading
Momentum tells you where the action is. Traders love it because:
It shows where money is flowing.
It helps you catch trends early.
It helps reduce guesswork.
Think of momentum as the market’s energy drink. A stock with high momentum has strong interest behind it—everyone wants a piece.
How Momentum Indicators Work
These indicators are based on the idea that prices tend to move in the same direction until something changes. They’re not magic, but they use math (often comparing current price levels to past ones) to detect when a trend is gaining or losing steam.
Most momentum indicators appear as a line graph below the main price chart, helping you decide whether to buy, hold, or sell.
Types of Momentum Indicators
There are several popular momentum indicators, but here are the key ones you should know:
a. Relative Strength Index (RSI)
RSI shows whether a stock is overbought or oversold. It ranges from 0 to 100. Over 70 = overbought; under 30 = oversold.
b. Moving Average Convergence Divergence (MACD)
MACD uses two moving averages to show trend direction and momentum. When the lines cross, it signals a change.
c. Stochastic Oscillator
This tool compares a stock's closing price to its price range over a period. It helps spot reversals.
d. Rate of Change (ROC)
ROC shows how quickly prices are changing. The higher the ROC, the stronger the momentum.
The Best Momentum Indicator for Beginners
If you’re new to trading, RSI (Relative Strength Index) is your best friend. It’s easy to read, simple to use, and widely trusted. RSI can keep you out of trouble by signaling when a stock might be about to cool off or heat up.
? Pro tip: Start with RSI set to 14 days—it’s the standard.
Momentum Trading Strategies That Work
Using momentum indicators isn't just about spotting movement; it’s about timing your actions. Here are a few proven strategies:
a. RSI Divergence
When the stock price rises but RSI falls, a reversal could be near. Time to think about selling.
b. MACD Crossovers
Buy when the MACD line crosses above the signal line. Sell when it dips below.
c. Breakout Trading
Watch for a stock breaking through resistance levels with strong momentum. That’s usually a green flag.
d. Pullback Strategy
Buy during a small drop in an uptrend. Momentum indicators can show whether it’s just a dip or a full reversal.
Combining Momentum with Other Tools
Momentum indicators work best when used with other analysis tools like:
Support & Resistance Levels
Volume Indicators
Moving Averages
Think of it as using both a flashlight and a map on a dark road. One shows you the way, the other confirms it.
Mistakes to Avoid in Momentum Trading
Even the best tools can fail if misused. Here are common traps:
Relying on one indicator alone
Chasing after high-flying stocks too late
Ignoring news or earnings reports
Not using stop-loss orders
Remember: Trading is about managing risk, not chasing profit.
Real-Life Examples of Momentum Trades
Let’s say a stock has been hovering around ₹500. Suddenly, it breaks to ₹550 on high volume, and RSI is above 70. That’s a classic breakout with strong momentum.
Or take a tech stock falling from ₹1,200 to ₹950, with RSI dipping below 30. This could signal it’s oversold and due for a bounce.
These examples happen every day. Spotting them early is the real skill.
Best Software for Trading in India
When it comes to trading, the right software makes all the difference. Here are a few top-rated platforms:
Quanttrix – Easy-to-use, powerful charts, and low brokerage.
Upstox – Fast execution, good for beginners.
Angel One – Great research tools and strong customer support.
Groww – Clean design, good for investing and trading both.
All these platforms support momentum indicators and charting tools.
Features to Look for in Trading Software
Before choosing a platform, make sure it includes:
Real-time charts and indicators
Customizable alerts
Mobile and desktop access
Low fees and fast order execution
A good platform is like a good cockpit—it gives you control and visibility.
Mobile Apps for Momentum Trading
Many traders now use their smartphones for real-time trades. Here are some great apps:
Quanttrix
Upstox Pro
Angel One Mobile
Groww App
They allow you to set alerts, analyze charts, and trade on the go—perfect for momentum trading.
Tips for Safe and Smart Trading
Here’s how to trade wisely:
Always use a stop-loss. It limits your losses.
Don’t trade on emotion. Momentum can be exciting, but stay logical.
Practice with a demo account first.
Set goals and stick to your plan.
Future of Momentum Trading
With AI, data analytics, and better tools, momentum trading is getting more sophisticated. Algorithmic trading is now picking up trends faster than ever. But human judgment still matters.
Soon, you might be using AI-powered tools to detect momentum shifts before they even show up on standard charts.
Conclusion
Momentum indicators can be your best allies in trading. Whether you're just getting started or looking to improve, learning how to read and use these tools is a smart step. Use reliable software, practice good strategies, and always trade with a plan.
You don’t need to be a math genius to use momentum indicators. You just need to pay attention, stay disciplined, and know when to ride the wave—or when to get off.
FAQs
1. What is the best momentum indicator for beginners?
The Relative Strength Index (RSI) is widely considered the best for beginners due to its simplicity and effectiveness.
2. Can I use momentum indicators for intraday trading?
Yes, many traders use momentum indicators like RSI and MACD for intraday setups.
3. Which is the best software for trading in India?
Top platforms include Quanttrix, Upstox, Angel One, and Groww—all of which support momentum indicators.
4. How do I avoid false signals in momentum trading?
Use momentum indicators alongside other tools like volume analysis and support/resistance levels to confirm signals.
5. Are momentum trading strategies good for long-term investors?
They’re typically better suited for short to medium-term trades, but some long-term investors use them to time entries or exits.